Cash flow forecasting for projects
Project management has many different facets. Getting all the legals in place to start, getting upfront and milestone payments, material supply and labour issues and weather delays to name a few. And each of these have cash flow implications which not only impact the relevant project, but your business overall and it’s crucial that you have an up-to-the-minute view of this so you can see in advance any shortfalls and take corrective action, as well as see in advance any surpluses so you can plan how to best use these. CFM makes all this easy as explained below.
What’s the best way to do this?
1. Project as separate plan
As you need to monitor and forecast each project as a separate entity, it makes sense to have each project as its own plan. This makes visibility of each project easier, and it’s much easier to edit plans of individual projects than try and find relevant transactions amongst a larger plan.
2. Merge projects into an overall picture
You need to do this to see if there are any global cash flow peaks or troughs. For example, you may have to order a supply in bulk for all projects at once, so this will represent a large cash outflow at one point in time, so you need to see the impact of this as you may need to arrange installment payments or get in some revenue earlier than anticipated to cover it.
How CFM makes it easy…
1. Create a template
You know what a base project in your business looks like so create one using the CFM Plan & Transactions template. Incorporate all the standard tasks. Each time you use the template for a new project, make edits to reflect differences in tasks as needed.
- Use Groups as main tasks, and transactions as sub-tasks.
- Whilst you must import a csv version of the template into CFM, keep a spreadsheet version so that you can use formulae to easily manipulate data. For example, your standard template will have typical
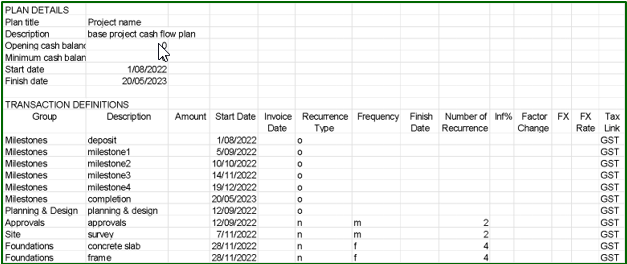
2. Syntax in description
Match your accounting general ledger and / or your project management software task list as much as possible to facilitate budget v actual analysis. You do this on for profit and loss, and you should also do it for cash flow purposes.
Use a prefix or suffix in the description to denote which project a transaction relates to. See the example below where a suffix based on the plan title is used. This is easily automated in Excel.

Otherwise, reporting at a merged level (see the plan called “portfolio” below) will not give you the detail of each project in the transaction list, and you won’t be able to work out project contributions on the merged reports. The only place you will see the delineation is where you compare all the projects on Graph View. You will of course see the detail if you look at reports on an individual basis.
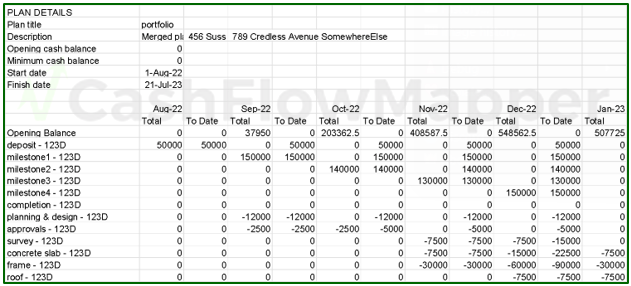
This approach will give you the most useful report in the Model – Transaction Report for merged plans, shown below. Here’s the ungrouped version where you can see each transaction and which project it belongs to.
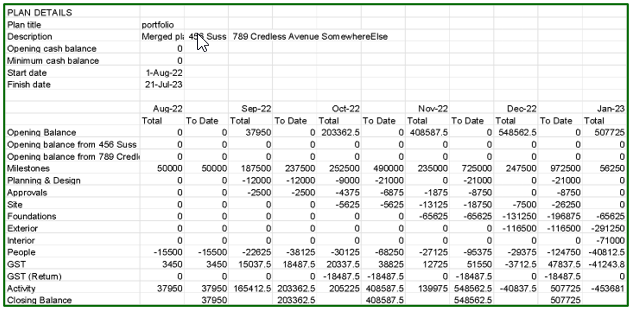
The grouped version will show your entire project portfolio in a summarised version and give you a summary across all groups.
- To get the grouped detail for an individual project, run the report from that project’s plan.
- If you want an overall portfolio report with reporting at a group level, then run the report for each plan and combine them. This way you have the option over the level of detail at the merged level.
- If you individualise the group headings in each plan, then you won’t get a summarised grouped report as above in the merged plan.
Let’s see how the plan for portfolio looks in the online Graph view. The “Grouped” views will be the same. It’s in the
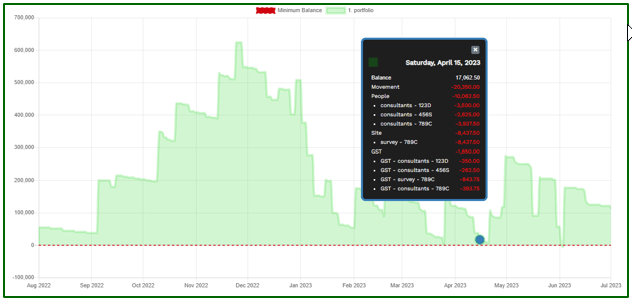
Here’s the portfolio graph which combines 3 projects – “Detail” view. All the descriptions are exactly the same, so you can’t see which projects the transactions (consultants, survey) belong to.
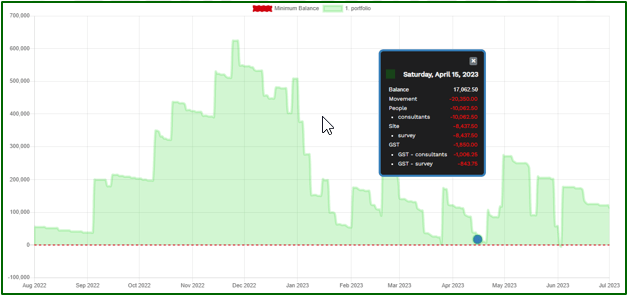
Now here’s the same plan where the project plans have an identifier added the transaction descriptions. You can see that there’s more information given on the cash flow movements.
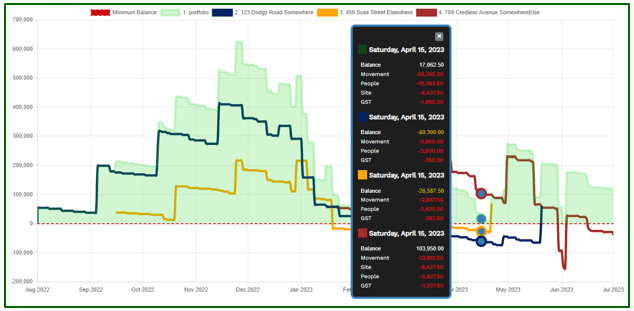
Let’s now do this comparison where the entire portfolio plan is compared with the project plans that comprise it. Ensure you enter graph view via the consolidated plan and compare the project plans from there. This is so the consolidated (merged) plan appears as the dominant green graph with shading and the project plans as single lines only.
In this case, because there’s commentary for each plan, the descriptions aren’t as critical, so you can get the detail we need by using the “Grouped” view. This image is the same for both examples. If you chose “Detail” view, the commentary would be very large, but you don’t need it for the compared graphs as the detail per plan is already shown.
Summary of cash flow reporting for projects in CFM
- After creating the initial plans, copy the project plans and roll them to create a living model of cash flow as upcoming changes are known. Merge the rolling plans into another consolidated plan which will automatically become a merged plan.
- Individualise transactions in each project’s plan.
- Keep the same group headings in all plans.
- Set the minimum cash balance in your merged plan. It defaults to the sum of the minimum balances in the project plans.
- As projects are complete in terms of cash flows, archive them and the merged plan will be updated.
- As new projects are added, remerge all live plans to get an updated merged plan.
- You may want to merge a plan for the non-project cash flows of your business as well to get an overall total business cash flow plan. This will be important to capture opening cash as this balance cannot be edited on the merged plan. If each of your projects has its own bank account, then the merged plan will capture the sum of these.
Where plans are merged, the merged plan is automatically updated with any edits to the project plans.
- Remember that recurring indefinitely transactions will continue for the life of the merged plan and not stop and the finish date of their respective plans. To avoid this issue, use only project-specific transactions in your project plans, and put recurring transactions (company overheads for example) in a plan for non-business cash flows.
- You’ll note that in some cases, such as the example above, whilst your portfolio of projects returns positive cash flows overall, due to timing of certain transactions, you may have times of tight cash flow. The CFM graph will illustrate this to you so can then work to alter the timing of transactions to avoid this.
Excel tips for manipulating plans
Whilst CFM plans need to be uploaded via a csv, which is plain text, manipulating a template or an existing plan in Excel is the quickest and easiest way to create or edit plans. Once you’re done, save the sheet as a csv file and import to CFM. Here’s an outline of a few tips. Remember, that once you’re done, save your import file in its own csv file, with only one sheet in it.
If you try and save a file with more than one sheet in it as a csv file, you’ll only have the first sheet saved.
1. Edit descriptions
- Add an extension
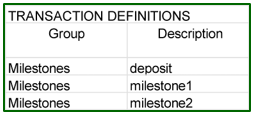 Here’s an extract of the plan upload file with the descriptions we want to add “- 123D” to, so we can identify the transactions for this project within our grouped reporting as shown in the examples above.

• The descriptions are in column B.
• The “-123D” is contained in column O.
• The formula to use in column P is highlighted in yellow.
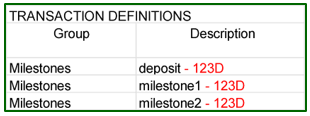
• Copy the values in column P to the descriptions in column B.
• Delete the data in columns O & P.
• Save your file as a csv and import it into CFM.
• Change the extension.
Let’s assume that you want to change the description in the above example to reflect a new project, 456S.
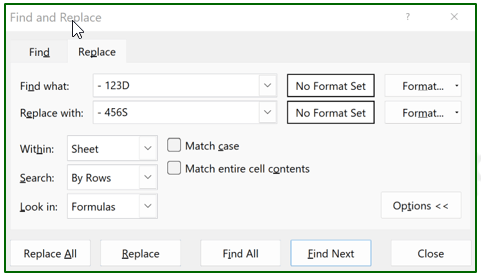
• Make a copy of the csv file.
• Highlight column B.
• Hit ctrl H on your keyboard.
• Enter “- 123D” in the “Find what:” field.
• Enter “- 456S in the “Replace with:” field.
• Click “Replace All.”

• Your file is now ready for import.
2. Set start dates for transactions
If you have a pretty good idea of the timeframe between stages of a project, then using date formulae to set up start dates of transactions saves time. Of course, the vagaries of projects means that these dates can often always be altered, but this will give you a good start, and the formulae are easily changed.
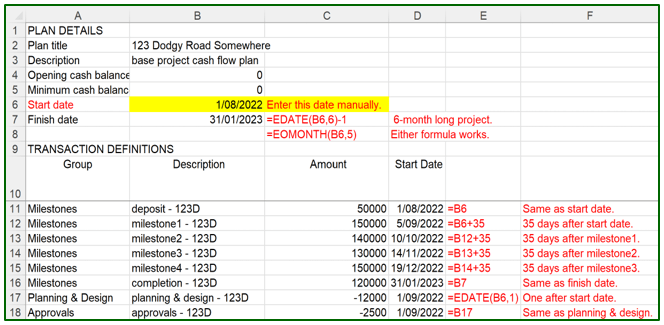
- In this example, the finish date of the plan, and the start date of the transactions are all driven by the start date of the plan.
- There are two possible formulae to use in cell B7 for the finish date of the plan, shown in C7 & C8.
- The formulae for the transaction start dates in cells D11:D18 are shown in cells E11:E18.


